Intro to Data Visualization with R
(for ecologists)
The essentials of creating your own publication-ready figures with R
Are you stuck on how to plot your data so it looks good?
Do you understand the basics of using R, but remain frustrated with how to make good plots?
Do you need to prepare some publication-quality figures for your next paper but don't know where to start?
Do you feel held back by base-R's built-in plotting tools and want to up your game with ggplot2?
If you've answered yes to any of these questions, then this course is definitely for you.
This is the course on data visualization in R that I wish I had when I started as a graduate student, and I built it to cover all the essential tools you need to know for quickly beginning to make professional and publication-quality figures in R. The best part is that I am able to cover all the essential basics in just a three-hour course!

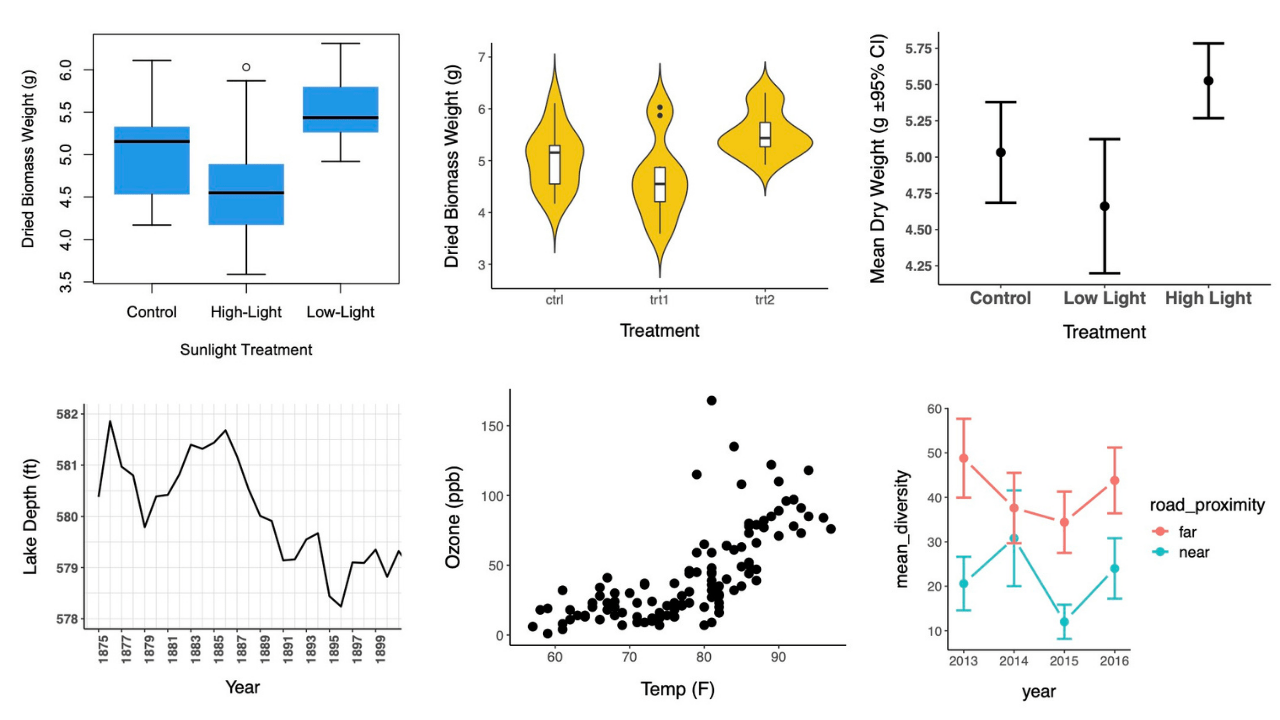
These are just some of the figures you'll learn how to create in this course ☝️
By the end of the course you will be able to confidently:
- Create simple figures using R's base package
- Export and save figures from R Studio
- Understand how the ggplot2 system works on a conceptual and technical level
- Plot the five most common types of ecology figures with ggplot2:
- Scatterplots
- Boxplots
- Lineplots
- Histograms
- Point and whisker plots
- Customize the look and feel of all of your plots
- Add custom annotations to plots using arrows, lines, or text
- Create publication-quality figures using plotting best-practices

Prerequisites:
- Though this course begins with the basics of plotting, you should already have a basic familiarity with using R and R Studio to get the most out of this course.
- Not sure if you do? Check out my course on the Basics of R here!
This course is a shortcut to learning how to create your own professional-looking figures in R quickly but effectively.
Though most content is designed and presented from my own perspective as an ecologist, all course content is also applicable to most related fields.
Once you join the course, you can…
- Ask me and my graduate assistant questions (within the course, under each lesson) at any time.
- Access all course materials for life.
- Watch and rewatch all the material online, at your own pace
- Earn credits towards the Ecological Society of America’s Professional Ecologist Certification program
- Get an official certificate of completion
Plus, there’s no risk!
My ultimate goal is to help you feel confident with R, so it is really important to me that this course is a good fit for you. If you’re unsatisfied with your purchase, contact me in the first 30 days and I’ll give you a full refund.
“There would have been a lot of tears and stress if I didn’t have your course!”
"I just wanted to send a quick email to say THANK YOU SO MUCH for what feels like saving my life with your R teaching!!! I am very grateful you decided to put together all of this content in the way that you have because it is SO useful! You’re a fantastic teacher and having your R lessons specific to ecological questions and typical datasets has been more useful than any of the books I’ve tried to get through. I recently needed to come up with some data exploration graphics FAST while I was away working in the field and there would have been a lot of tears and stress if I didn’t have your Intro to Data Viz course.
Thank you, thank you, times a gazillion! Your work is going to help me do science so much more efficiently instead of spending needless hours bashing my head against a computer!"
— Rachel S-L
Graduate Student in the Centre for Wildlife Ecology at Simon Fraser University and Research Associate at Pacific WildLife Foundation
"An awesome course, especially for the ones who likes to see their graphs smart and visually appealing! Though I've been using R and ggplot for quite a while, this course taught me so many very basics of ggplot and data visualization, as a result my graphs are being more beautiful. Thanks to Luka and his great teaching skills."
— Rabindra P.
"So easy to follow! Examples were really relevant to the work that I do. I will definitely pull these up and use them when I'm creating my own graphs. Also, the explanations and step-by-step instructions that slowly built up a graph, adding layers and showing examples of how to customize the data visualization, were super helpful."
— Anonymous student
Choose your enrollment plan below
Student / Early Career
$175
Same as professional plan, but priced for students and early career ecologists
ENROLL HEREEsme P, Conservation Biologist and Research Assistant
"Luka has a knack for finding the most understandable and innovative ways of breaking down and explaining processes. Luka undoubtedly made my relationship with R and statistical analysis less complicated!"


Dr. Nishanta Rajakaruna
Professor in Plant Biology,
CalPoly State University
"Luka is perfect for teaching a course on R for ecologists—he has a strong theoretical background in ecology, numerous experiences in field- and greenhouse-based studies, a knack for data analyses, and a life-long passion to teach."
Credits from R for Ecology courses go towards the Ecological Society of America’s Professional Ecologist Certification program!
Learn more here: ESA Ecologist Certification Program


